FDV vs Market Cap: What Each Number Actually Tells You
FDV vs market cap explained: what each valuation metric measures, why they diverge, and how to read the gap before you evaluate or launch a token.


#FDV and market cap answer two different questions
#The one-sentence version
Market cap measures the value of the tokens trading right now. Fully diluted valuation, or FDV, measures what that value would be if every token that will ever exist were circulating today. The gap between the two is not a rounding difference, it is a direct measurement of how much future dilution the market has not yet had to absorb.
#Why the same token can show wildly different numbers
You have probably seen this before: two numbers attached to the same token, one modest, one enormous, both described as "valuation." That is not an error on someone's part. Market cap and FDV are answering two separate questions, and comparing them without knowing which question each one answers is how a reasonable person ends up badly misreading a project.
FDV vs market cap is a comparison worth understanding before you evaluate anyone's token, including your own, because the two questions are not interchangeable. The business question underneath them is what the token is supposed to do for the company that issued it: whether the value the business creates has anywhere to accrue, and whether the supply still waiting to unlock has been sized against real revenue rather than against a hoped-for price. Market cap tells you what the market currently prices as tradeable today. FDV tells you what the market would have to absorb if every locked token hit circulation at today's price. Neither number is wrong. Each one is incomplete without the other, and the difference between them is where the real signal lives.
#Market cap: what it measures right now
#The formula
Market cap is circulating supply multiplied by current price. That is the entire calculation. It is a snapshot, not a forecast, and it changes every time the price moves or the circulating supply changes.
#What "circulating" actually excludes
The word doing the real work in that formula is "circulating." Circulating supply is only the tokens that are actually free to trade right now. It excludes locked team allocations still under vesting, investor tranches that have not yet unlocked, and treasury reserves the project has not released. Those tokens exist. They were minted, they are accounted for in the total supply, and at some point most of them will reach the market. Market cap simply does not count them yet.
This is why market cap is the number most trackers and exchanges show first, and also the number most likely to understate real dilution risk. A token with a modest, reassuring market cap can still have a massive wall of unreleased supply sitting behind it, and market cap alone will never tell you that. For the mechanics of how that locked supply gets released over time, see how to read a token unlock schedule.
#FDV: what it measures once every token exists
#The formula
FDV is max supply multiplied by current price. Instead of counting only what is tradeable today, it prices out the entire eventual supply at today's rate.
#Why FDV is a forecast, not a fact
FDV assumes the full max supply is unlocked and priced at today's number, an assumption that is almost never true on the day the calculation is made. That is exactly why FDV is useful. It is uncomfortable by design. It shows what the market would have to absorb if every locked token hit circulation at current prices, whether or not the project's marketing acknowledges that possibility.
A high FDV relative to market cap is the market's own math pricing in future supply. It does not matter whether a project frames its story around scarcity or growth. The unlocked-versus-locked math sits underneath the story regardless, and FDV is the number that surfaces it. The allocation and vesting choices behind that gap are covered in more depth in our guide to the token distribution model.
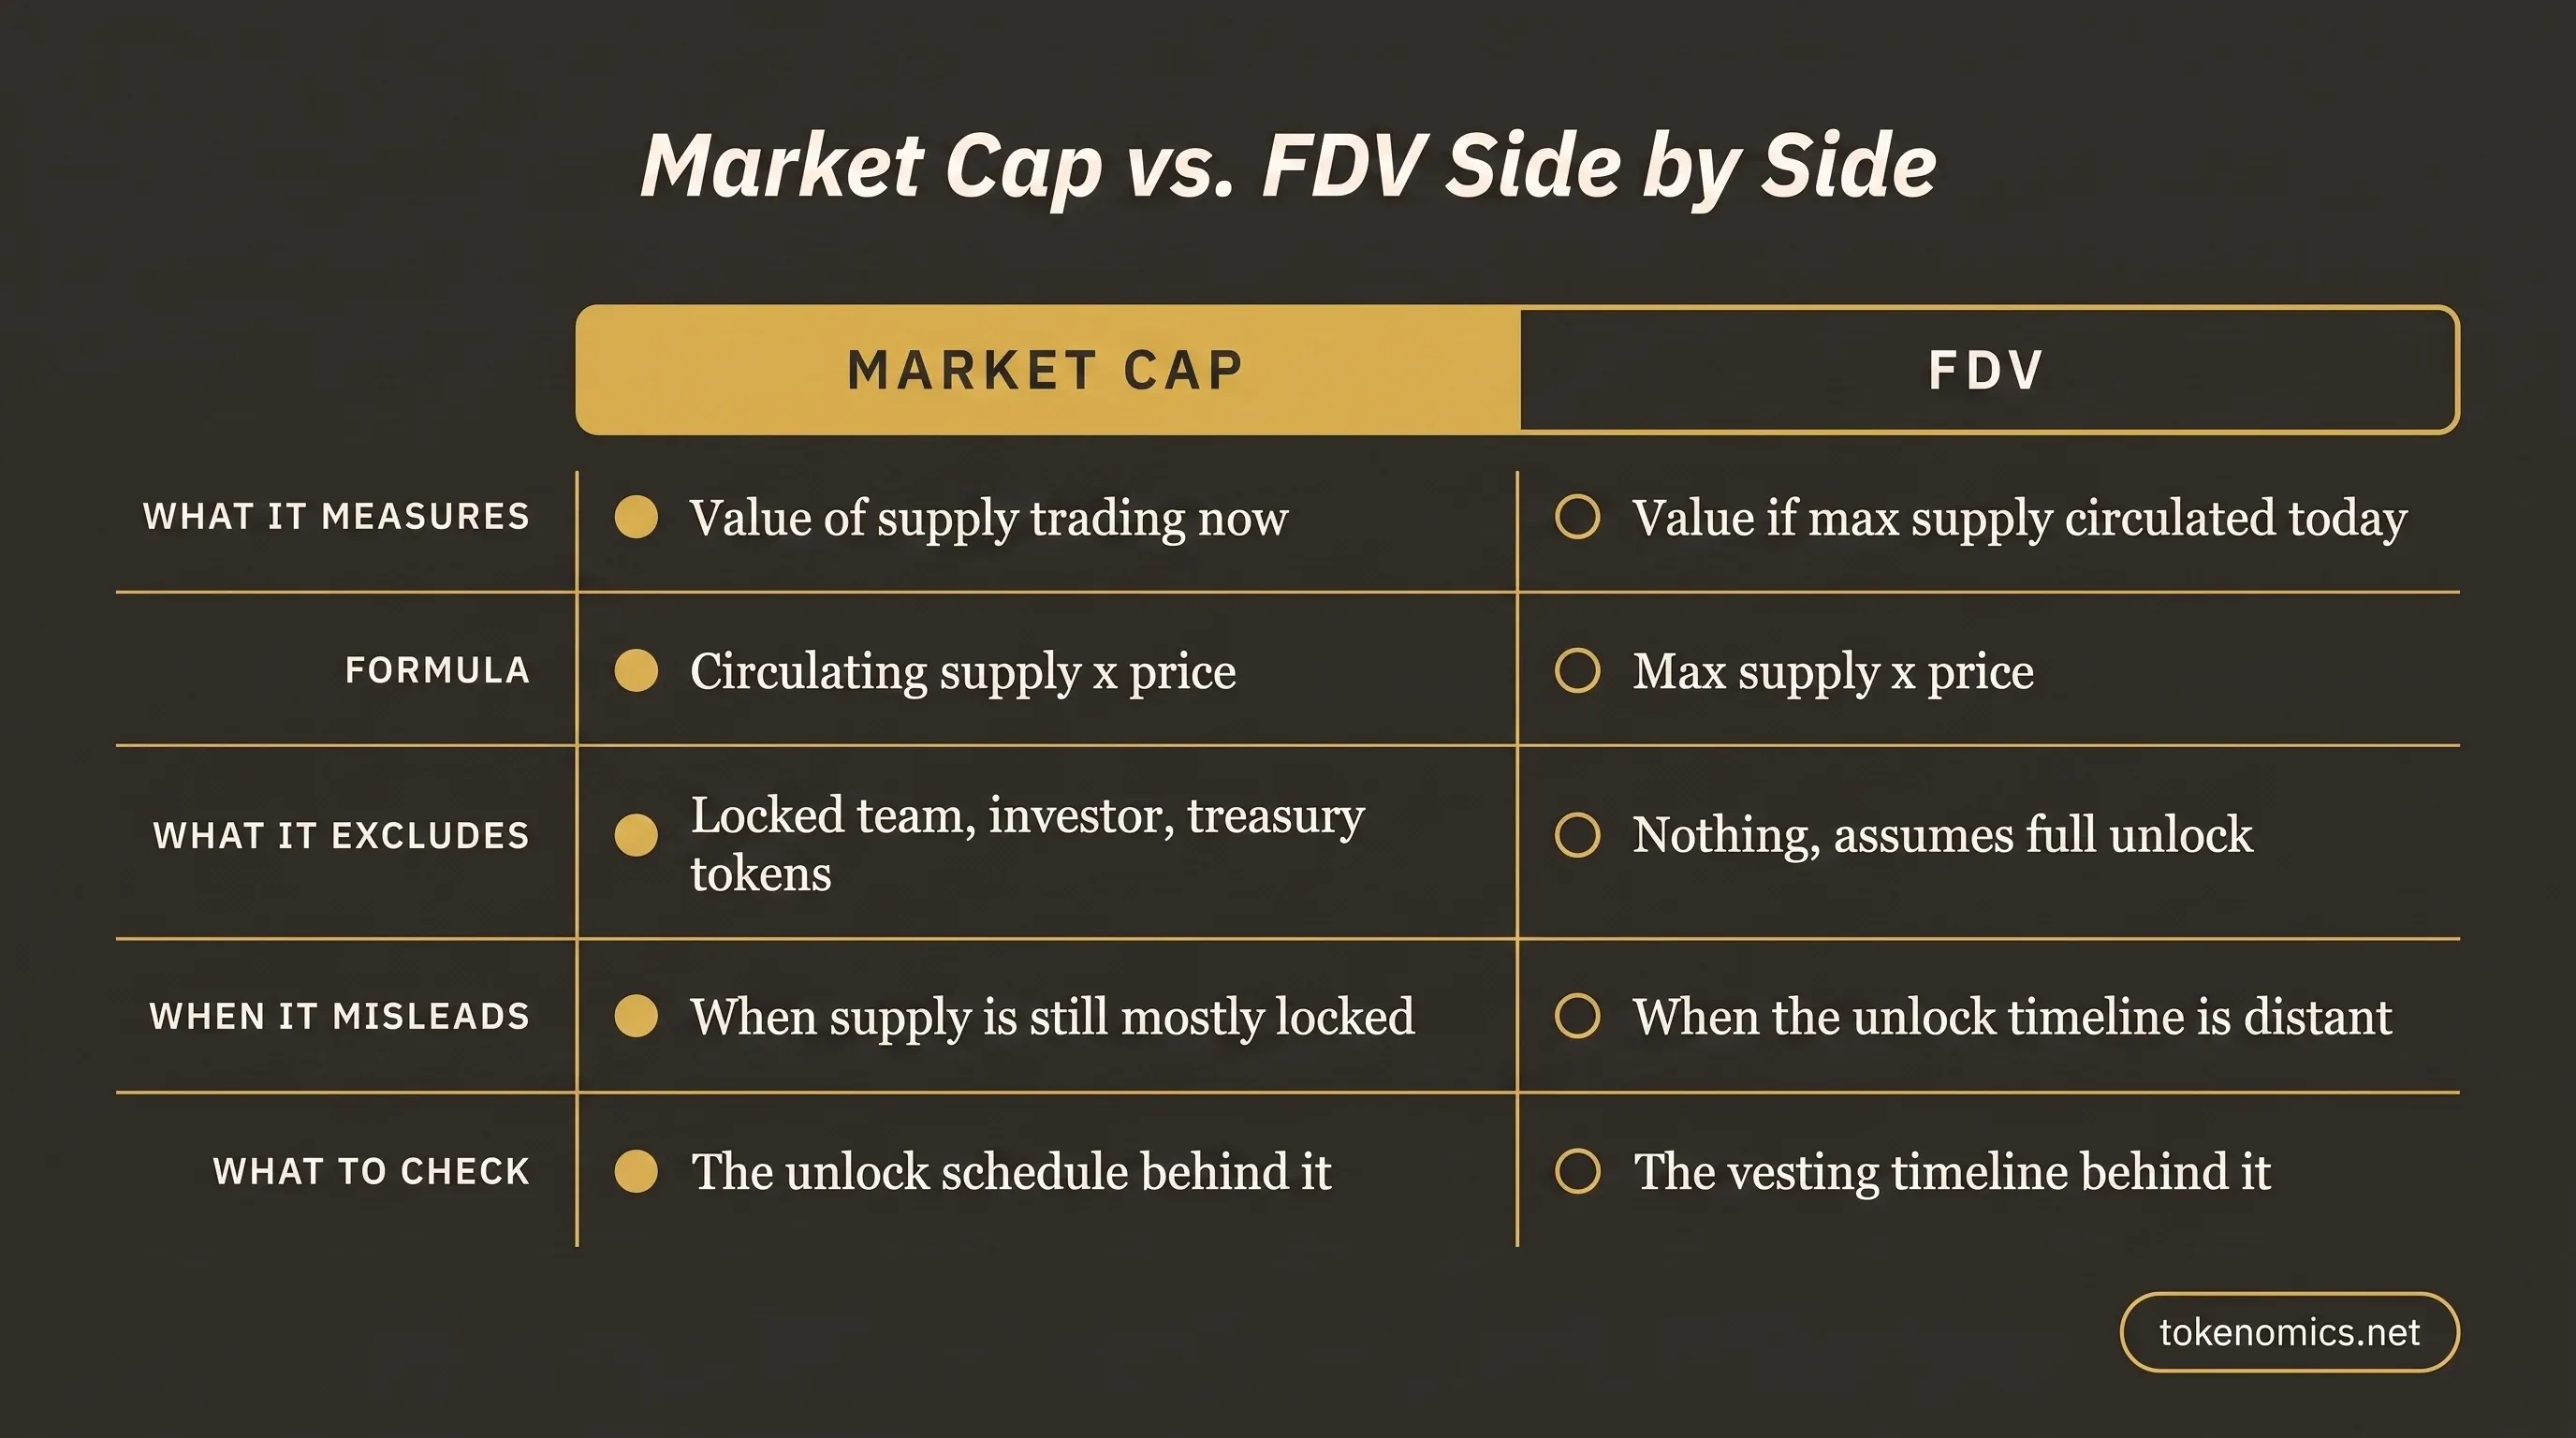
#FDV vs Market Cap Side by Side
#Comparison table: what each metric includes, excludes, and is best used for
| Market Cap | FDV | |
|---|---|---|
| What it measures | Value of the supply trading right now | Value if the entire max supply were circulating today |
| Formula | Circulating supply x current price | Max supply x current price |
| What it excludes | Locked team allocations, unvested investor tranches, unreleased treasury reserves | Nothing, it assumes full unlock at today's price |
| When it misleads | When a large share of supply is still locked, understating future dilution | When the future unlock timeline is distant or uncertain, overstating near-term pressure |
| What to check instead | The unlock schedule behind the circulating number | The vesting timeline behind the gap to FDV |
#A worked example
Take a fully hypothetical token, call it Token X, with round numbers to keep the math visible. Token X has a circulating supply of 100 million tokens trading at 1 dollar each. That puts market cap at 100 million dollars. Token X also has a max supply of 1 billion tokens. At that same 1 dollar price, FDV comes out to 1 billion dollars.
That is a ten-to-one gap between the two numbers. In plain terms, only 10 percent of Token X's eventual total supply is actually circulating today. The other 900 million tokens, whatever combination of team allocation, investor tranches, and treasury reserve they represent, are still sitting outside the market. Whether that is a problem depends entirely on when those tokens unlock and how fast, which is a question the two numbers alone cannot answer. It is a question the vesting schedule answers.
#Why the gap between them is the real signal
#A wide gap means most of the supply hasn't hit the market yet
Here is the point most explainer content stops short of: the size of the FDV-to-market-cap gap is not a footnote to the two definitions, it is the actual diagnostic. A wide gap is a proxy for how much sell pressure is still sitting on the sidelines in the form of unvested allocations. A narrow gap means most of the eventual supply is already circulating and there is less unlock pressure ahead. A ten-to-one gap, like the Token X example above, means the market is currently pricing a token whose story is nine-tenths unwritten.
Too much content treats FDV and market cap as two facts to memorize and stops there. That misses the point of tracking either number. The gap between them is the signal. The two figures on their own are just inputs.
#Historical pattern
Large vesting cliffs tend to concentrate seller intent: everyone eligible to sell gains that option on the same day, rather than gradually over weeks or months. That mechanism, not any single historical dataset, is why a wide FDV-to-market-cap gap is worth watching rather than dismissing as an abstraction. When a large tranche of tokens unlocks simultaneously, the recipients now have a choice they did not have the day before, and some portion of them choose to sell. A wide FDV-to-market-cap gap is a way of measuring how large that eventual choice point is, well before it arrives.
#The FDV-to-market-cap ratio as a due-diligence check
#What a healthy ratio range looks like versus a red-flag range
A useful heuristic for founders and diligence-minded readers alike: an FDV-to-market-cap ratio far above roughly three to five times deserves a direct question about the vesting timeline behind it, not an assumption in either direction. A ratio in that healthier range generally means a meaningful share of supply is already circulating, so the unlock overhang ahead is smaller. A much higher ratio does not automatically mean a project is dishonest or doomed. It means there is a larger future supply event to understand before you draw a conclusion.
#What to ask a team when the ratio is high
If you are looking at a token with a wide gap between FDV and market cap, the productive move is a specific set of questions rather than a verdict. Ask when the next major unlock happens and how large it is as a percentage of current circulating supply. Ask whether unlocks are scheduled as a cliff, all at once, or as a linear release over time. Ask which allocations, team, investors, treasury, make up the bulk of the locked supply, since that tells you who holds the incentive to sell once they can. None of these questions require you to already be a tokenomics expert. They just require you to look past the two headline numbers to the schedule behind them. If you want a structured second opinion before you are staring at a live valuation gap, that is exactly what our Token Launch Strategy service is built to pressure-test.
#Common mistakes when comparing FDV and market cap across projects
#Comparing a low-FDV token to a high-FDV token without checking vesting timelines
Two tokens can carry wildly different FDV figures for reasons that have nothing to do with which one is the better investment or the better-designed system. A lower FDV token with a fast, front-loaded unlock schedule can face more near-term dilution pressure than a higher FDV token with a long, gradual release. Comparing the raw FDV numbers side by side without checking the timeline behind each one is comparing two things that are not actually comparable.
#Treating market cap alone as "the" valuation and ignoring FDV entirely
Screenshotting a market cap ranking and treating it as the full picture is one of the most common versions of this mistake. Market cap only counts what is already circulating. Ignoring FDV means ignoring how much of the eventual supply has not entered the picture yet, which is precisely the part most likely to affect price later.
#Treating FDV alone as a red flag without checking the unlock schedule behind it
The opposite mistake is just as common: seeing a large FDV number and reacting to it as an automatic warning sign. A high FDV paired with a long, gradual, well-structured vesting schedule is a very different situation than a high FDV paired with a cliff unlock arriving in a few months. The number alone does not tell you which one you are looking at. The schedule does.
If you want your own token's FDV-to-market-cap story stress-tested before launch, or a second opinion on a project you are evaluating, that is a conversation worth having early. Book a strategy call to walk through the numbers together.